
The State Similarity Index attempts to quantify how similar US states are to each other. The index is a statistically-based way to measure this. 20% of the index is based on infrastructure. 16.66% of a state’s technology score (3.33% of the overall State Similarity Index score) is allocated for the state’s water infrastructure. The following factors were included in the calculation:


Water Usage
In the United States, there are extreme differences in the amount of water used per capita, depending on the state. Wyoming uses the most, since it is a sparsely populated state with many irrigated farmlands and a significant amount of mining. Both of these activities require a substantial amount of water. On the other end of the spectrum, states in New England tend to use the least amount of water per capita. They do not have a lot of agricultural land and get a significant amount of rainfall anyway. Furthermore, there is not a huge amount of industry taking place in these states. These states have also implemented water conservation measures to reduce their consumption.
Source:
United States Geological Survey
States were categorized by gallons of water used per 100 days, per capita:
0-.4, .4-.8, .8-1.2, 1.2-1.6, 1.6-2, 2-4, 4-6, 6-8, 8-10, 10-12, 12-14
Public Water Supply
Public water is supplied to homes by a water system operated by local governments or utilities. These systems treat, distribute, and manage the water supply to ensure it meets health and safety standards. In Maine, only 50% of their residents use a public water supply at home, the lowest percentage in the country. Many property owners in the state have private wells instead, because public systems are not common in rural areas. Arizona has the highest percentage of people reliant on public water supplies. Despite not being the most densely populated state, a very high percentage of its residents live in urban areas. Furthermore, since Arizona is one of the driest states, water is scarce.
Source:
United States Geological Survey
States were categorized by percentage of water supplied by the public water system:
50-58.3, 58.3-66.6, 66.6-75, 75-83.3, 83.3-91.6, 91.6-100


Septic Systems
Septic systems are used in areas where homes are not connected to a municipal sewage system. They are designed to treat and dispose of household wastewater in a safe and efficient manner. Over 50% of homes in Vermont and Maine have a septic system, the highest in the country. In contrast, very few homes in California have septic systems, since a majority of their population lives in urban areas.
Source:
US Census Bureau
States were categorized by percentage of homes with a septic system:
0-10, 10-20, 20-30, 30-40, 40-50, 50-60
Location of Water Source
There are extreme differences in the percentage of surface water versus ground water used in public water supplies. Mississippi has the highest percentage taken from groundwater. The state’s underground aquifers are relatively stable and provide a consistent source of water throughout the year. In contrast, a high percentage of Colorado‘s comes from surface water. Colorado is a much drier state than Mississippi, so water is scarce. The state has a complex system of regulations governing its use. In Colorado, water rights are granted based on who first put the water to beneficial use.
Source:
United States Geological Survey
States were categorized by percentage of surface water withdrawn:
14-28, 28-42, 42-56, 56-70, 70-84, 84-98


Salinity of Water Source
The vast majority of water in the United States is supplied from freshwater sources, such as lakes, rivers, and aquifers. However, there are a few states where a significant percentage of its water supply comes from the ocean. These states have costly desalination plants to supplement their freshwater sources. States on the Atlantic Coast, like Connecticut, Maryland, and New Hampshire actually get a more of their water supply from the salt water and brackish water. There are natural limitations on freshwater supplies in coastal areas, where population densities tend to be the highest.
Source:
United States Geological Survey
States were categorized by percentage of freshwater as source in public water supply:
18-31.66, 31.66-45.33, 45.33-59, 59-72.66, 72.66-86.33, 86.33-100
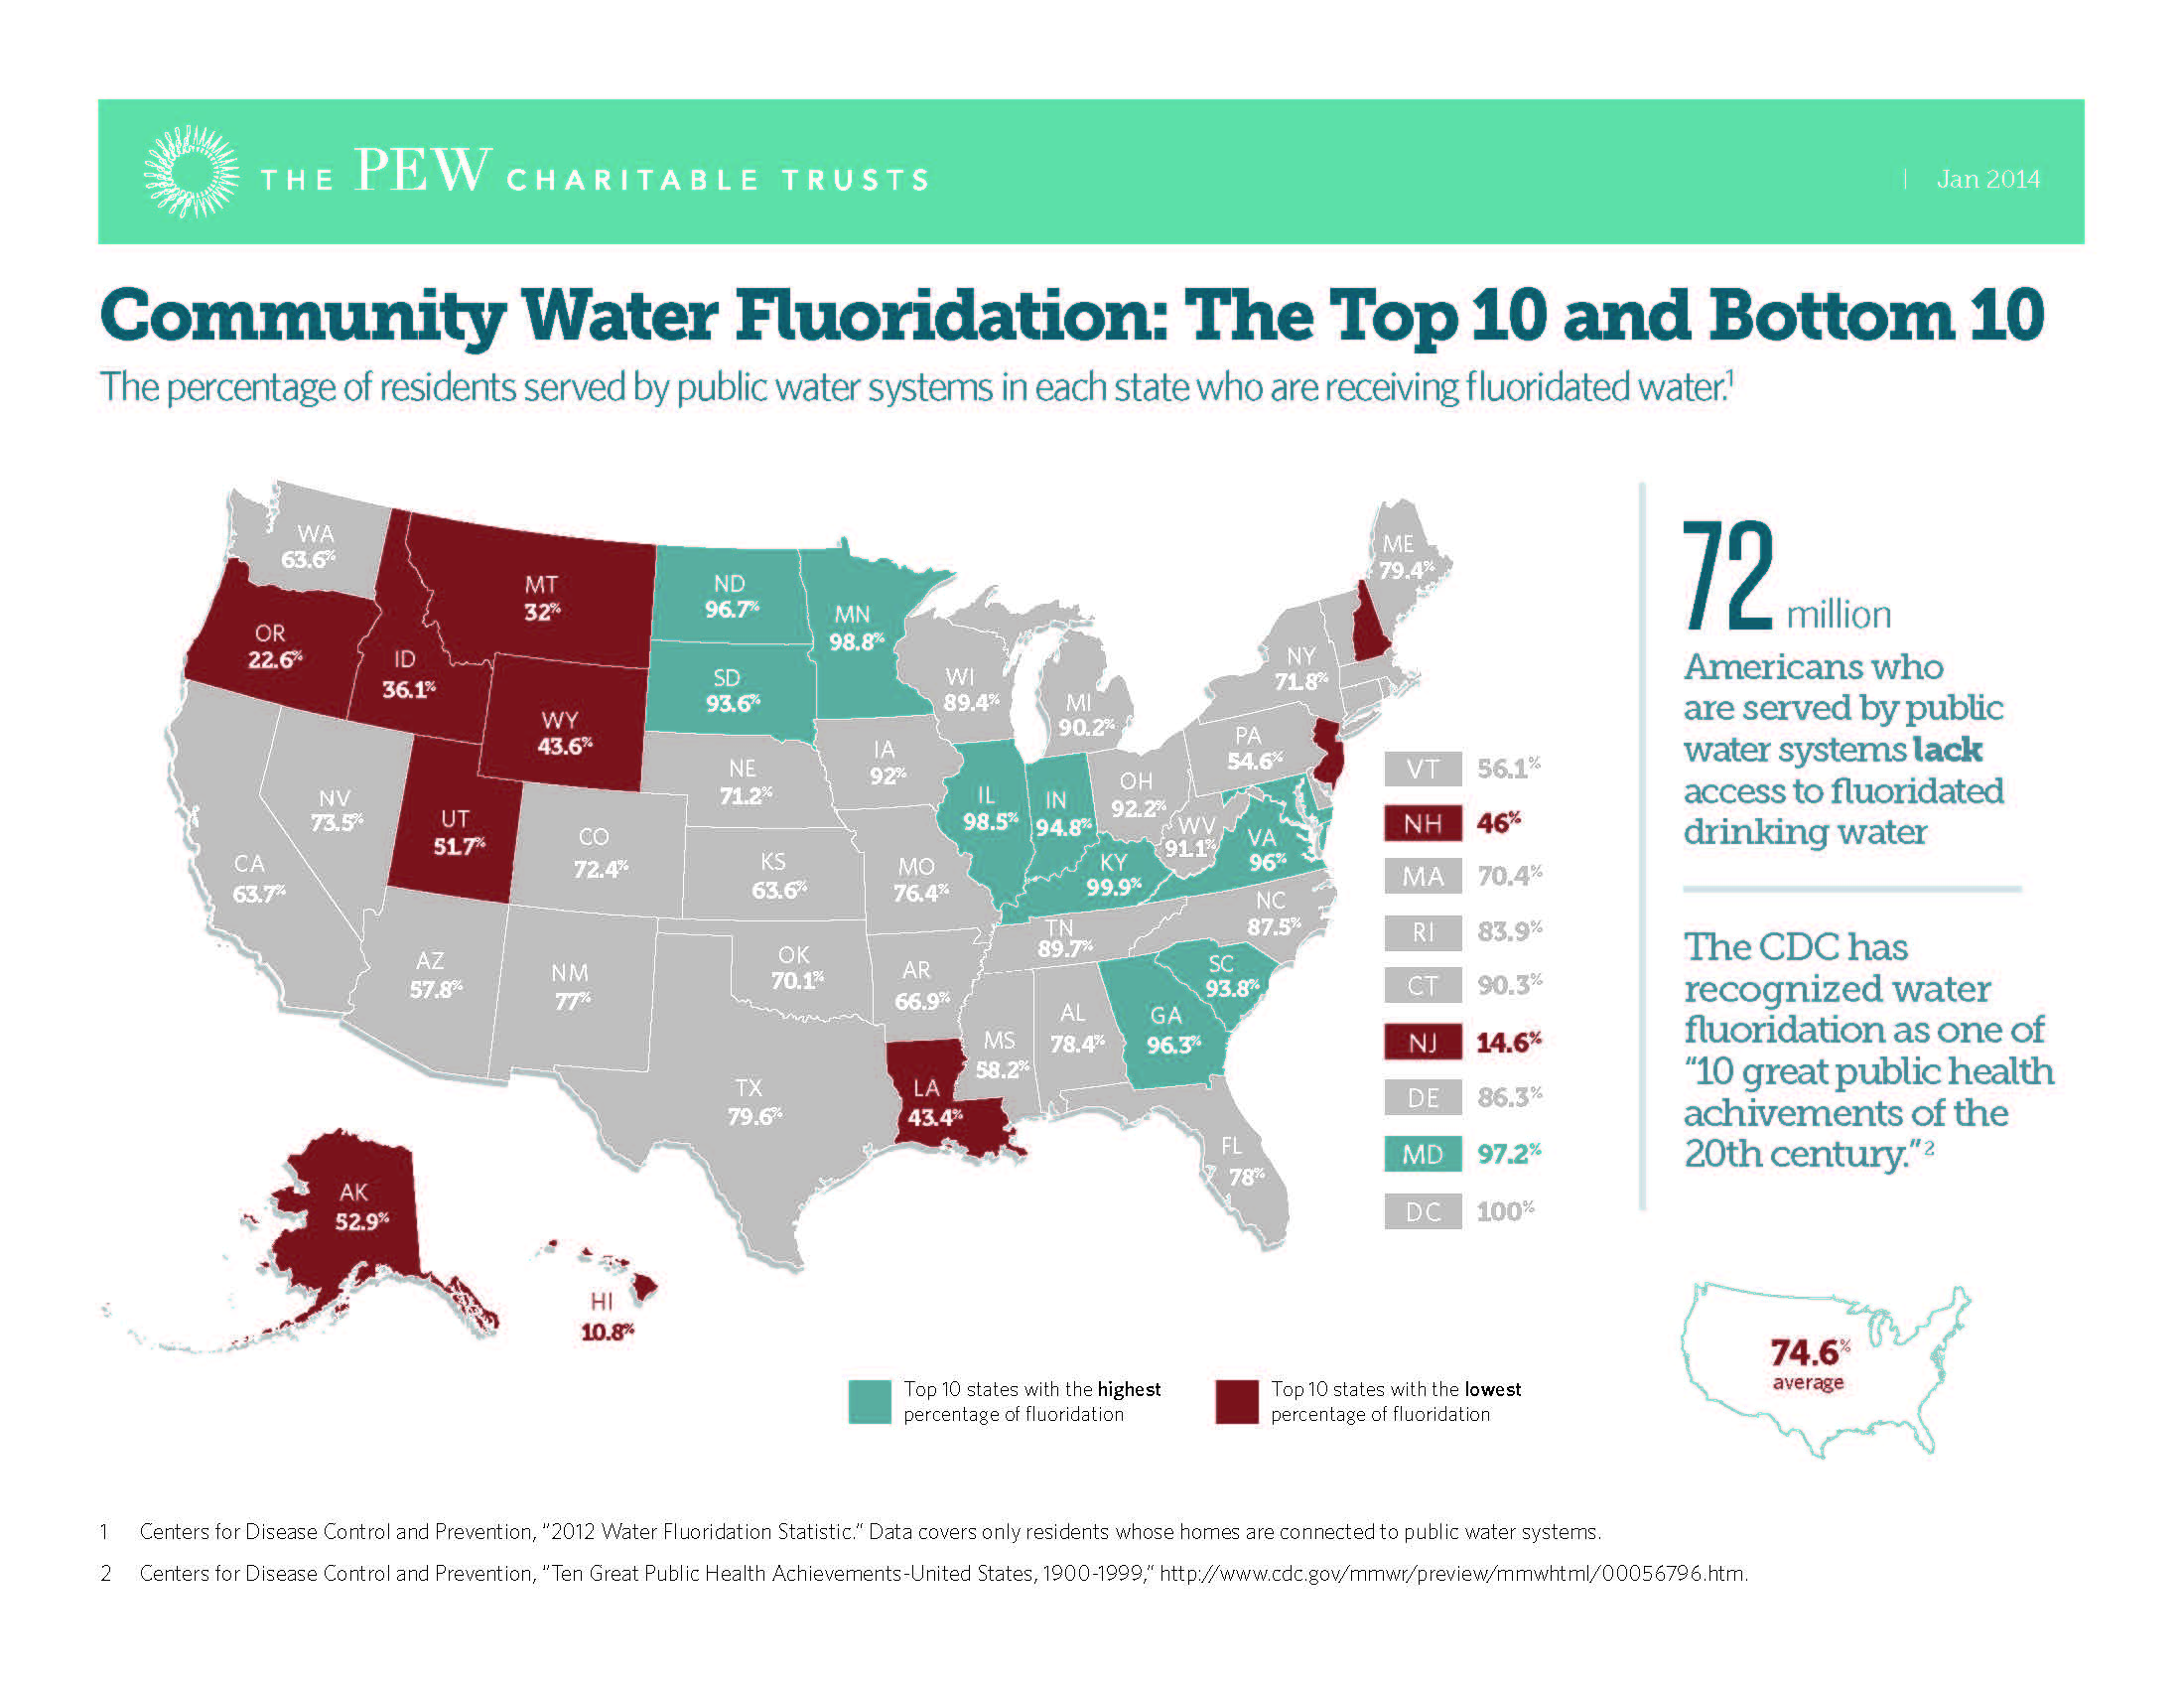
Fluoride in Water Supply
Health organizations recommend water fluoridation as a safe way to improve oral health and prevent tooth decay. While some states mandate that all public water be fluorinated, not all communities fluorinate their water. In Hawaii and Oregon, fluoridation is not mandated, while in New Jersey fluoridation is mandated, but exceptions are made for concerns over the safety or finances. Therefore, little of the public water in these states is fluorinated. However, there are laws in over 30 states that require the water to be mandated.
Source:
Centers for Disease Control Prevention
States were categorized by percentage of public water that is fluorinated:
10-25, 25-40, 40-55, 55-70, 70-85, 85-100


Mineral Content in Water Supply
The hardness of water is determined by the concentration of dissolved minerals, such as calcium and magnesium, in the water. Hard water can reduce efficiency and lifespan of home appliances. Water hardness can vary within a state or even within a city, depending on the source of the water and the treatment processes it goes through. South Dakota and other states in the Great Plains region have the hardest water, since the region is rich in sedimentary rock that contain high levels of dissolved minerals. Therefore, water softeners are commonly used in these states. New Hampshire has especially soft water. Its bedrock is composed of granite and other igneous and metamorphic rocks, which do not contain as many dissolved minerals.
Source:
Water Quality Association
States were categorized into the following groups by hardness of water:
Soft Water
Slightly Hard Water
Moderately Hard Water
Hard Water
Very Hard Water
Extremely Hard Water